
Labour
7.500 hours × €30,55/hour (Netherlands) or €2,25/hour (Agadir scenario), plus separate supervision. The Agadir hourly amount is not a verified sector wage.
Tomato production costs and energy-related CO₂ emissions: Netherlands versus Agadir.
A transparent, line-by-line comparison covering labour, energy, water, growing supplies, packaging, capital, financing and operating overhead. Both locations are modelled as one-hectare unlit tomato greenhouses; local energy supply differs.
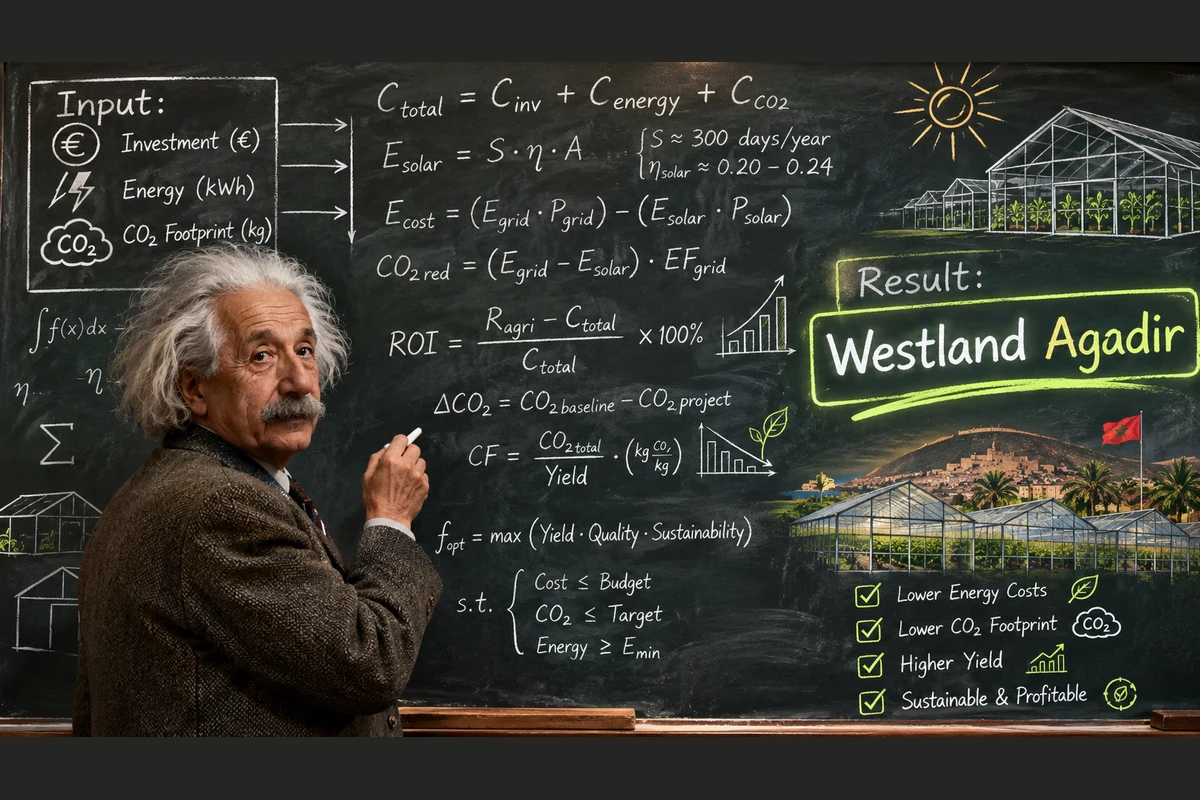
Scenario results per hectare at an assumed saleable output of 400 tonnes per year at each site. These figures are not verified farm accounts.
Identical growing structures do not guarantee identical crop yields. The equal yield assumption is used only to compare the individual cost components.
| Input | Netherlands | Agadir | Status |
|---|---|---|---|
| Net greenhouse growing area | 10.000 m² | 10.000 m² | Common project size |
| Saleable tomato yield | 400 t/year | 400 t/year | Assumption, not field-verified |
| Artificial grow lighting | None | None | Project design |
| Greenhouse structure and crop automation | Same basis | Same basis | Supplier quote needed |
| Photovoltaic panels | No installation in reference case | 3 kWp scenario | Site-specific energy design |
| Solar thermal storage | Not included in Dutch model | Included in Agadir investment budget | Engineering and supplier quote needed |
| Fossil heating | Gas-heated reference case | No fossil heating | Different climate provisions |
| Water recycling | Yes | Yes | Water sourcing and costs open |
| Grower and harvest work | 7.500 hours/year | 7.500 hours/year | Assumed same hours; actual staffing not confirmed |
An important distinction: the Dutch 209.000 m³ figure is a published gas-equivalent heating requirement for an unlit reference tomato greenhouse, not an observed gas meter reading from the planned greenhouse. The model prices the case in which that heating requirement is supplied entirely by gas. The Dutch case has no PV under the project’s site-space constraint.
The 28 cost lines below are shown individually, including the original workbook notes. Figures are annual euro amounts for one hectare.
| Annual cost item / 1 ha | Netherlands (€) | Agadir (€) | Explanation and basis |
|---|---|---|---|
| Labour and management | |||
| Greenhouse growing and harvesting labour | €229.125,00 | €16.875,00 | 7.500 growing and harvesting hours; management budgeted separately |
| Greenhouse manager and crop management | €30.000,00 | €14.000,00 | Annual budget estimate; not verified |
| Subtotal — Labour and management | €259.125,00 | €30.875,00 | |
| Energy and grid | |||
| Natural gas, energy tax and CO₂ levy | €227.153,44 | €0,00 | Netherlands: WUR reference heat demand of 209.000 m³ gas equivalent (not measured gas consumption); two 2026 energy-tax brackets plus CO₂ levy. |
| Grid electricity after direct use of PV power | €40.350,00 | €66,36 | Annual load profile and supply contract unavailable; solar electricity is not free |
| Fixed electricity and grid charges | €0,00 | €259,74 | Depends on contracted power and connection capacity |
| Subtotal — Energy and grid | €267.503,44 | €326,10 | |
| Water and cultivation inputs | |||
| Water and water treatment | €9.000,00 | €9.000,00 | Agadir water source not yet selected; provisional budget |
| Young plants and propagation material | €18.000,00 | €18.000,00 | Same provisional budget pending local quotations |
| Nutrients and fertilisers | €16.000,00 | €16.000,00 | Same provisional budget |
| Crop protection and pollination | €14.000,00 | €14.000,00 | Biological crop protection and pollination, without double counting |
| Substrate, twine and clips | €10.000,00 | €10.000,00 | Consumable supplies |
| Irrigation consumables and filters | €7.000,00 | €7.000,00 | Fixed equipment is not charged twice |
| Supplementary CO₂ for crop enrichment | €3.000,00 | €3.000,00 | Requirement and CO₂ source not yet determined |
| Subtotal — Water and cultivation inputs | €77.000,00 | €77.000,00 | |
| Packing, quality and local transport | |||
| Packaging materials | €20.000,00 | €20.000,00 | Cost per saleable kg; excludes greenhouse harvest and sorting labour |
| Outsourced sorting and pre-cooling | €16.000,00 | €16.000,00 | Only additional outsourced costs; greenhouse labour is separate |
| Certification, residue and laboratory tests | €6.000,00 | €6.000,00 | Traceability and laboratory testing |
| Domestic transport to regional export hub | €15.000,00 | €15.000,00 | Does not include international freight to EU customers |
| Subtotal — Packing, quality and local transport | €57.000,00 | €57.000,00 | |
| Land and business overhead | |||
| Land lease or annual land charge | €20.000,00 | €8.000,00 | Do not also depreciate purchased land |
| Administration, banking and compliance | €12.000,00 | €8.000,00 | Makes overhead costs visible |
| Sales and trading, fixed budget | €10.000,00 | €10.000,00 | Transaction-based commissions not yet established |
| Waste disposal, cleaning and consumables | €5.000,00 | €5.000,00 | Capital equipment maintenance accounted for separately |
| Subtotal — Land and business overhead | €47.000,00 | €31.000,00 | |
| Annualised capital, finance and insurance | |||
| Greenhouse depreciation | €75.000,00 | €75.000,00 | 20-year useful-life assumption |
| Solar-thermal storage depreciation | €0,00 | €20.000,00 | Annual depreciation calculated from the location-specific investment |
| Climate and irrigation equipment depreciation | €20.000,00 | €20.000,00 | Same provisional investment |
| Solar PV depreciation | €0,00 | €182,65 | PV equipment is not treated as cost-free |
| Sorting and cooling equipment depreciation | €10.000,00 | €10.000,00 | No additional note in model |
| Interest on initial financing | €54.000,00 | €63.082,19 | Year 1; principal repayments and equity return excluded |
| Equipment maintenance | €36.000,00 | €42.054,79 | No double counting of growing consumables |
| Insurance premiums | €18.000,00 | €21.027,40 | Quotation required for the actual insurance coverage |
| Subtotal — Annualised capital, finance and insurance | €213.000,00 | €251.347,03 | |
| TOTAL / HECTARE / YEAR | €920.628,44 | €447.548,14 | All 28 rows, including investment charges |
| PRODUCTION COST PER TONNE (400 t/ha) | €2.301,57 | €1.118,87 | Annual total ÷ assumed saleable tonnes |
7.500 hours × €30,55/hour (Netherlands) or €2,25/hour (Agadir scenario), plus separate supervision. The Agadir hourly amount is not a verified sector wage.
Greenhouse, crop automation, thermal storage, PV and packing equipment are charged through depreciation, interest, maintenance and insurance. Their purchase values are not expensed in full again.
Identical budgets for growing supplies, packing and sorting are retained in the absolute totals; they cancel in the difference only if actual services and quantities prove equal.
Power consumption, imported grid electricity and PV electricity are different quantities. The local equipment ratings still need supplier confirmation.
| Component | Calculation | Annual cost |
|---|---|---|
| Gas purchased | 209.000 m³ × €0,89/m³ | €186.010,00 |
| Gas energy tax, first band | 170.000 m³ × €0,18020 | €30.634,00 |
| Gas energy tax, second band | 39.000 m³ × €0,15881 | €6.193,59 |
| Gas CO₂ charge | 209.000 m³ × €0,02065 | €4.315,85 |
| Gas and applicable charges | Sum of four lines | €227.153,44 |
| Purchased electricity | 150.000 kWh × €0,269/kWh | €40.350,00 |
| NET PURCHASED ENERGY | Gas + electricity | €267.503,44 |
Dutch electricity is the H1 2026 CBS price for the modelled business-consumption band. Gas €0,89/m³ is a market snapshot from 15 November 2026, not a long-term supply contract. The 209.000 m³ figure represents the full reference heat requirement modelled as gas consumption.
| Greenhouse installation | Calculation basis (preliminary) | kWh/year |
|---|---|---|
| Irrigation pumps | 10.000 m³; 35 m head; 60% efficiency | 1.589 |
| Water-recycling pumps | 2.000 m³; 15 m head; 55% efficiency | 149 |
| Fertiliser dosing | 1 kW × 1 h × 300 days | 300 |
| Filtration and UV | 0,5 kW × 3 h × 300 days | 450 |
| Climate computer and sensors | 0,15 kW × 8.760 h | 1.314 |
| Automatic vents | 10 × 0,37 kW × 0,25 h × 300 days | 278 |
| Shade screen motors | 8 × 0,37 kW × 1/6 h × 300 days | 148 |
| Heating, grow lighting, mechanical dehumidification | Not fitted in Agadir base case | 0 |
| TOTAL EQUIPMENT ELECTRICITY | Preliminary design calculation | 4.228 kWh |
The individual consumption figures above are assumptions from an initial sizing exercise. No manufacturer schedule, irrigation head curve or real operating-hours log has yet been provided. Water desalination, common sorting, packing, cold storage and any additional cooling are not included in this core equipment-only estimate; those may differ by location and must be evaluated before a complete footprint is claimed.
| Component | Calculation | Annual result |
|---|---|---|
| Total electricity for listed greenhouse equipment | Sum of the seven device categories | 4.228 kWh |
| PV electricity used directly | Illustrative overlap of sunshine and equipment use | 3.571 kWh |
| Residual grid import | 4.228 − 3.571 | 657 kWh |
| Purchased grid electricity | 657 kWh × €0,10100457/kWh | €66,36 |
| Grid capacity charge | Illustrative agricultural connection | €259,74 |
| Grid purchases and capacity | Sum of above cost components | €326,10 |
Do not interpret 657 kWh as a forecast. The 3 kWp PV capacity and 3.571 kWh self-use are model inputs, not a verified hour-by-hour solar production simulation. PV depreciation, loan interest, maintenance and insurance appear in the full cost table. The solar-thermal reserve is not an electrical-heating requirement.
Calculated from the model's gas use, purchased net electricity and life-cycle PV electricity. The numbers below are not a complete product carbon footprint.
| Emissions calculation / year / hectare | Netherlands | Agadir |
|---|---|---|
| Natural gas use | 209.000 m³ × 2,134 kg CO₂e/m³ | 0 m³ |
| Natural gas CO₂e | 446,006 tonnes | 0 tonnes |
| Purchased grid electricity | 150.000 kWh × 0,244 kg CO₂e/kWh | 657 kWh × 0,602 kg CO₂e/kWh |
| Grid electricity CO₂e | 36,600 tonnes | 0,396 tonnes |
| On-site PV, life-cycle estimate | None | 3.571 kWh × 0,062 kg CO₂e/kWh |
| PV-related CO₂e | 0 tonnes | 0,221 tonnes |
| TOTAL ENERGY-RELATED CO₂e | 482,606 tonnes/year | 0,617 tonnes/year |
| PER TONNE SALEABLE TOMATOES (400 t/ha) | 1.206,52 kg CO₂e/t | 1,54 kg CO₂e/t |
| PER KILOGRAM SALEABLE TOMATOES | 1,2065 kg CO₂e/kg | 0,0015 kg CO₂e/kg |
Steel, glazing, plastics, irrigation machinery, PV manufacture and thermal storage, allocated by real lifetime.
Manufacture and transport of plant material, nutrient solution, substrate, crop-protection products and associated direct emissions.
Supply, treatment, recycling, crop residues, refrigerant leakage and any supplementary CO₂ enrichment.
Price per tonne changes with actual saleable yield. The initial model varies packaging and outsourced sorting (€90/t together) in line with output, while all other annual amounts stay unchanged.
| Annual saleable yield | Netherlands / t | Agadir / t | Difference / t |
|---|---|---|---|
| 200 t/ha/year | €4.513,14 | €2.147,74 | €2.365,40 |
| 250 t/ha/year | €3.628,51 | €1.736,19 | €1.892,32 |
| 300 t/ha/year | €3.038,76 | €1.461,83 | €1.576,93 |
| 350 t/ha/year | €2.617,51 | €1.265,85 | €1.351,66 |
| 400 t/ha/year | €2.301,57 | €1.118,87 | €1.182,70 |
| 450 t/ha/year | €2.055,84 | €1.004,55 | €1.051,29 |
| 500 t/ha/year | €1.859,26 | €913,10 | €946,16 |
| 550 t/ha/year | €1.698,42 | €838,27 | €860,15 |
| 600 t/ha/year | €1.564,38 | €775,91 | €788,47 |
This is a mathematical sensitivity table rather than a prediction. Real labour, fertiliser, energy and post-harvest expenses will also move with output.
| Purchased gas | Total annual costs NL | Cost per tonne |
|---|---|---|
| 0 m³ | €693.475,00 | €1.733,69 |
| 25.000 m³ | €720.746,25 | €1.801,87 |
| 50.000 m³ | €748.017,50 | €1.870,04 |
| 75.000 m³ | €775.288,75 | €1.938,22 |
| 100.000 m³ | €802.560,00 | €2.006,40 |
| 150.000 m³ | €857.102,50 | €2.142,76 |
| 209.000 m³ | €920.628,44 | €2.301,57 |
Other inputs remain constant. If a Dutch site has a non-fossil heat source, its actual installation costs and emissions must replace the modelled natural gas system. A lower gas number without accounting for replacement heat is not a full alternative scenario.
Commercial orders can be managed through Dutch and European partners while actual shipments go directly to the buyer from the better-positioned greenhouse.
Sell via the shared network, deliver directly from the Dutch production site.
Sell through the same network, deliver directly to Spain, France, Italy or other markets without routing via Rotterdam.
Compare total transport costs, route emissions, shelf-life, quality and delivered price for each actual contract.
At the hypothetical model output of 400 t/ha, 450 hectares of actual production greenhouses would produce 180.000 tonnes/year. A 450-hectare gross site includes roads, infrastructure, water storage and services, so its net greenhouse area could be smaller. This is a scale illustration, not a production forecast.
Source links and the exact 15 November Excel calculation are available for review. Measurements, supplier quotes and the full product life-cycle inventory are the next steps.
Growers, technology companies and investors can discuss the commercial potential and independent verification of the Westland Agadir Centre model.
Contact Westland Agadir Centre ↗